Debug Log Studio - User Guide
Author: Annindya Das | Version: 2026
New to Debug Log Studio? Complete the Post-Install Setup Guide before using this guide.
Table of Contents
1. Overview
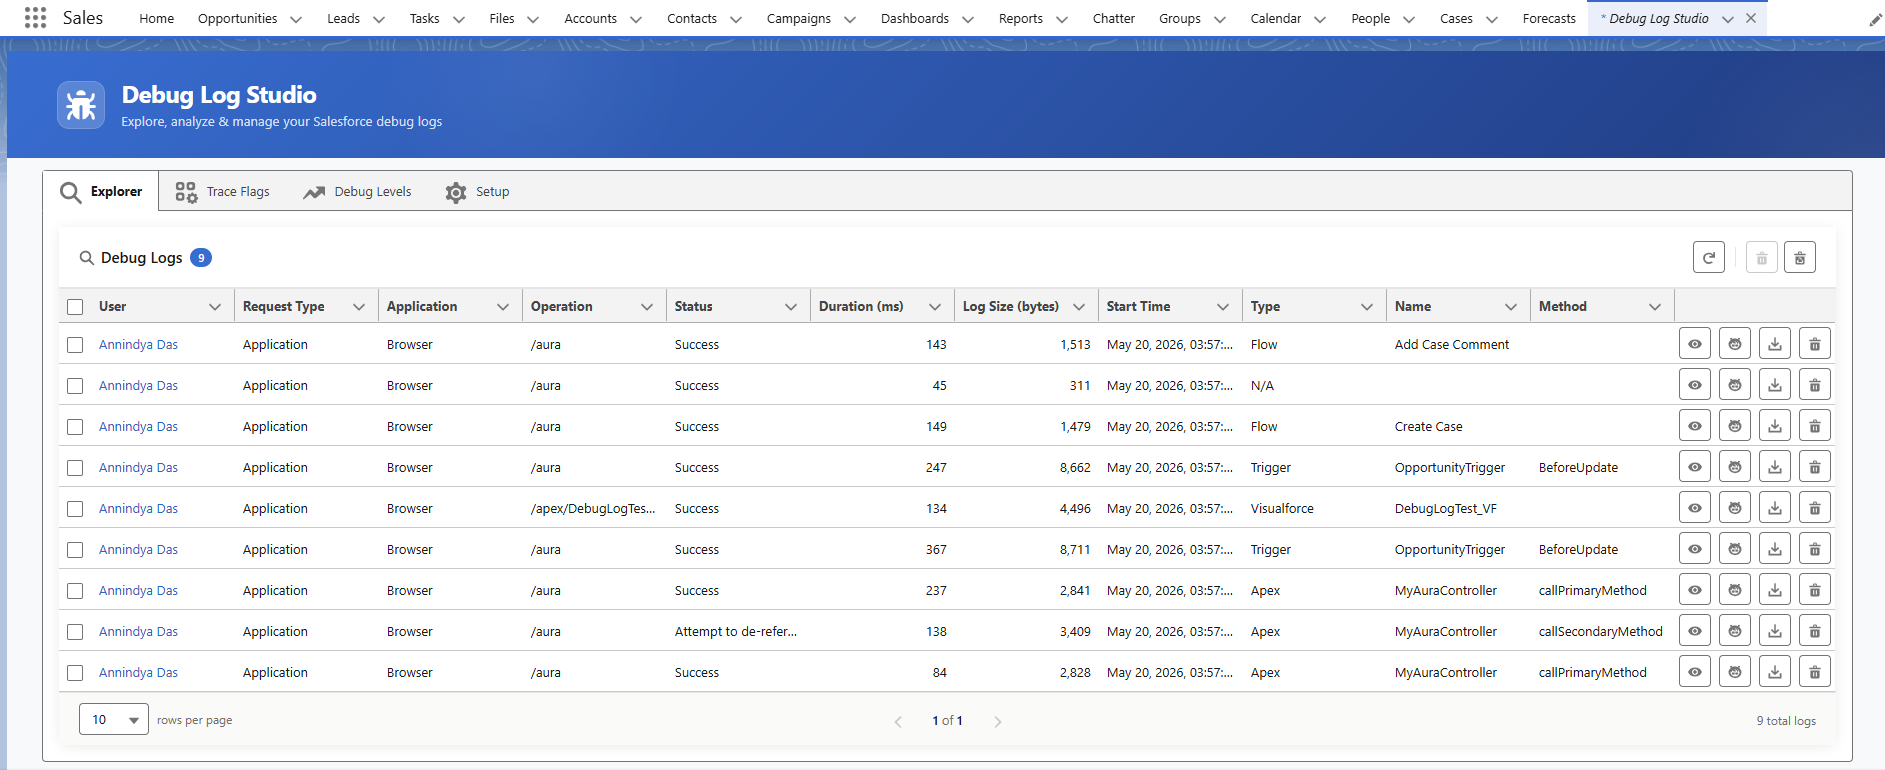
Once setup is complete, open Debug Log Studio from the App Launcher. The interface has four tabs:
| Tab | Purpose |
|---|---|
| Explorer | View, analyse, download, and delete captured debug logs |
| Trace Flags | Create and manage trace flags to start capturing logs for users |
| Debug Levels | Create and manage debug level configurations |
| Setup | One-time configuration wizard - see Post-Install Guide |
Recommended order of use:
- Create or verify a Debug Level → 2. Activate a Trace Flag → 3. Trigger activity in your org → 4. View logs in the Explorer
2. Debug Levels Tab
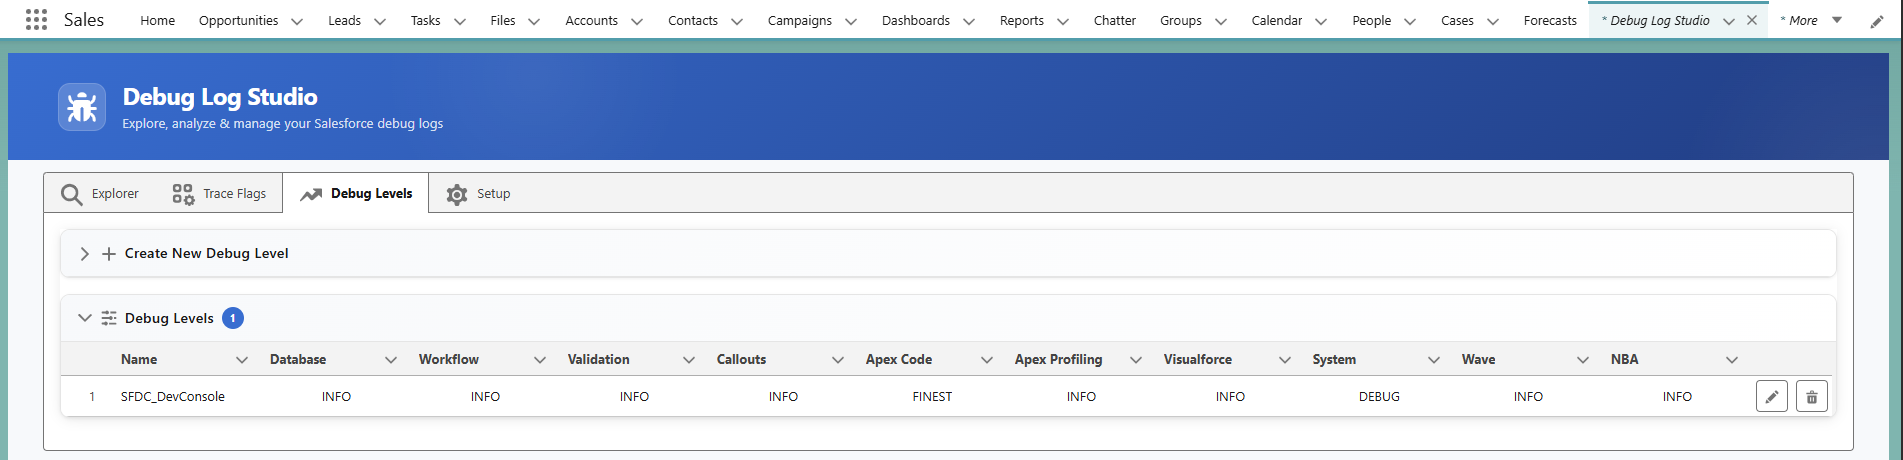
The Debug Levels tab lists all Debug Levels from your org, automatically loaded on open.
Creating a New Debug Level
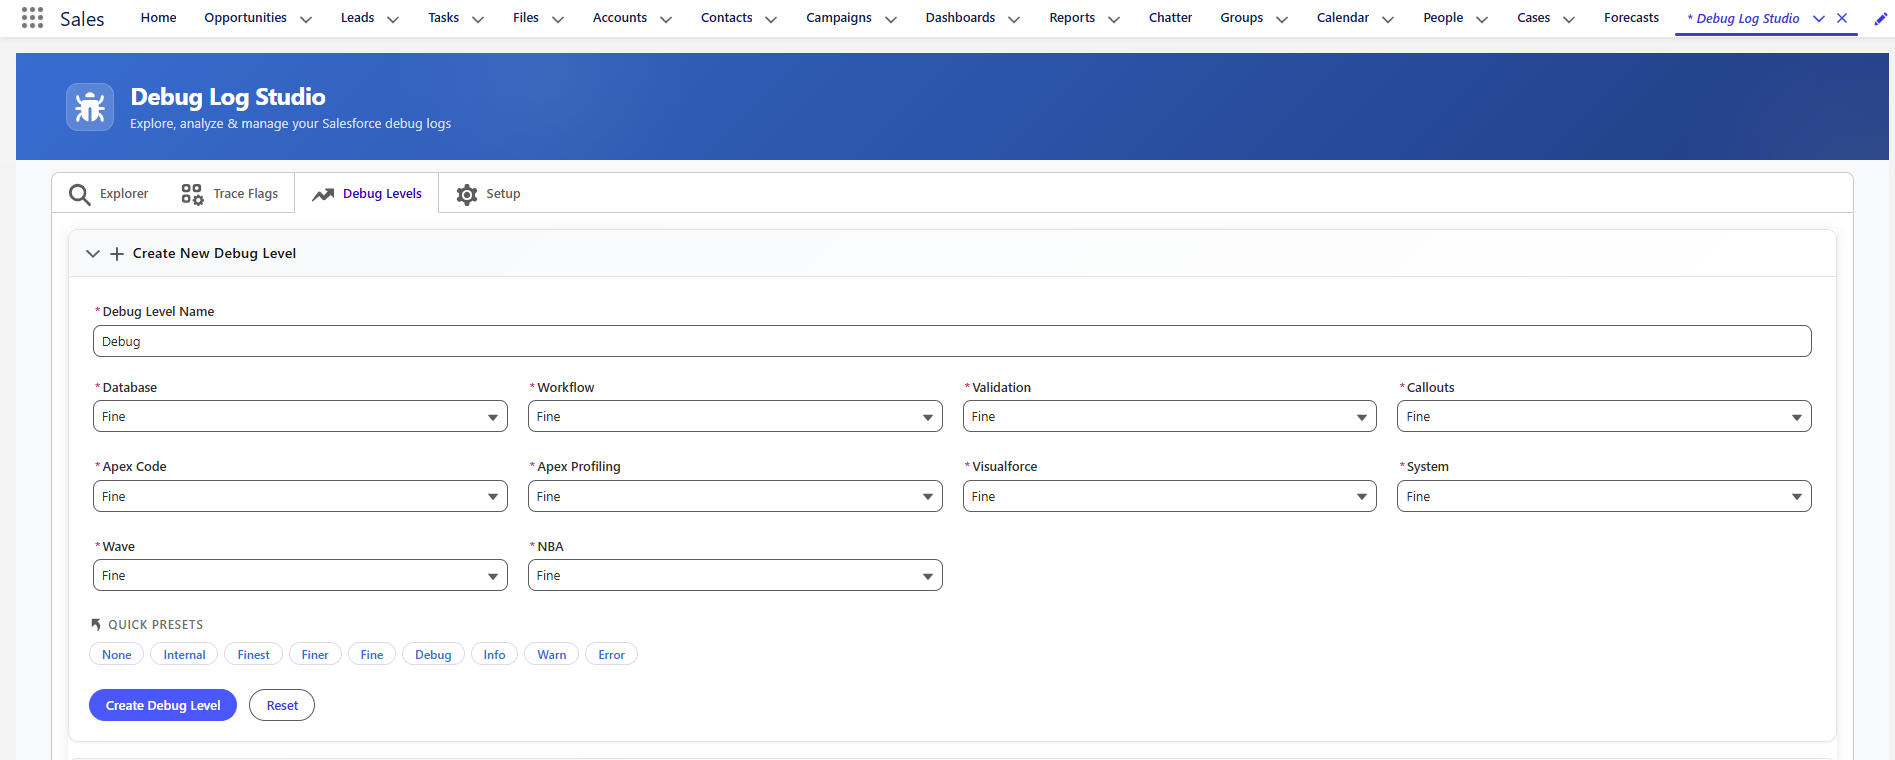
- Click ”+ Create New Debug Level” to expand the creation form.
- Provide a Debug Level Name.
- Set individual log levels for each category: Database, Workflow, Validation, Callouts, Apex Code, Apex Profiling, Visualforce, System, Wave, NBA.
- Click “Create Debug Level”.
💡 Tip: Use the Quick Presets (None / Internal / Finest / Finer / Fine / Debug / Info / Warn / Error) to set all categories to the same level instantly.
Editing or Deleting a Debug Level
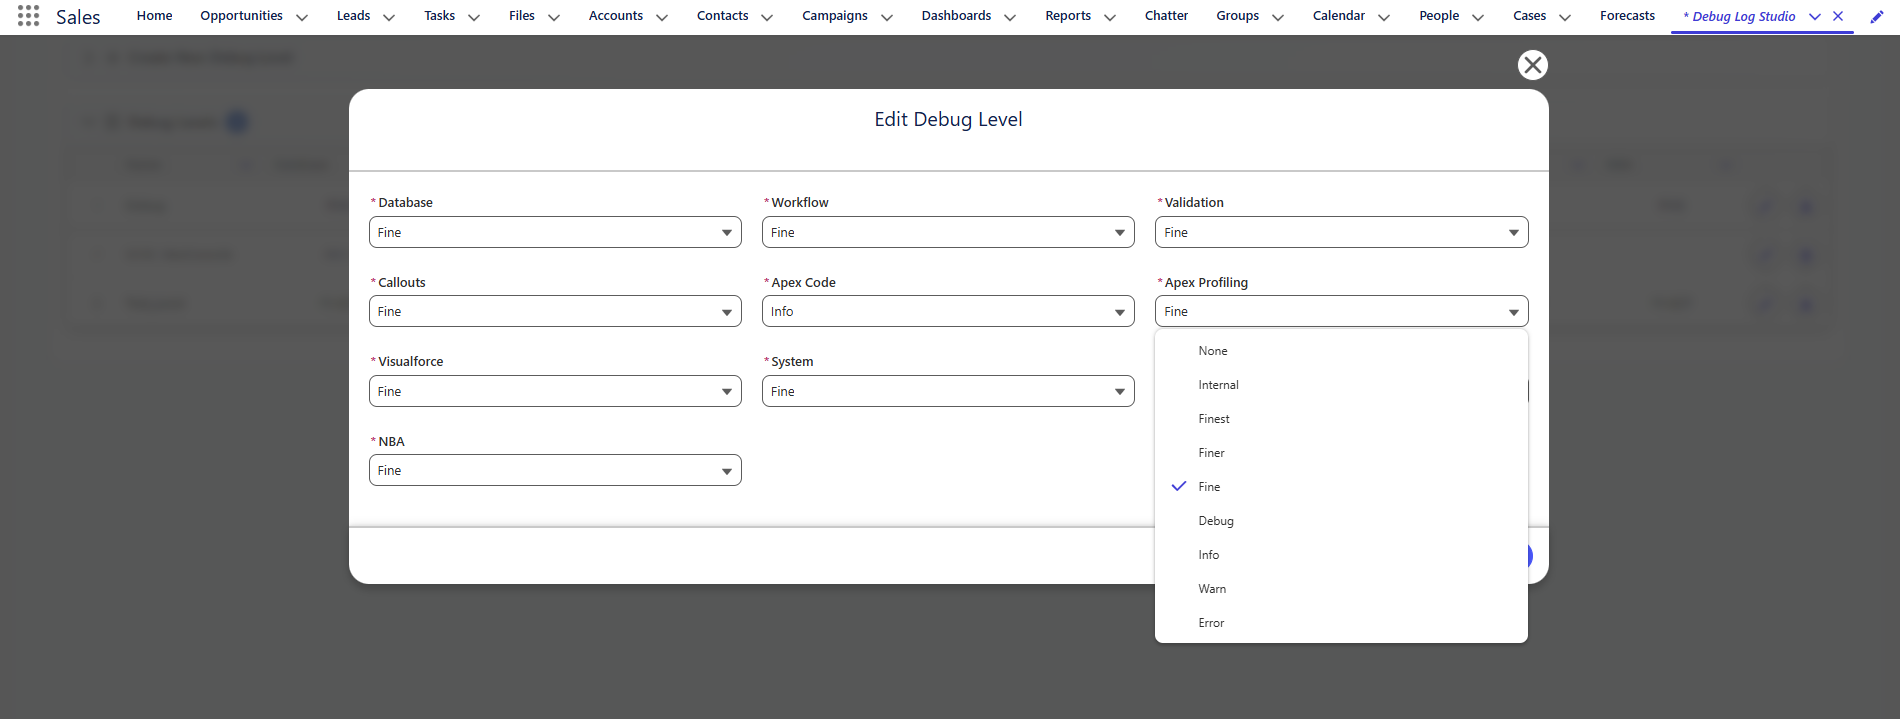
- Click the pencil icon on a row → modify fields in the pop-up → click Update.
- Click the delete icon to permanently remove a Debug Level.
3. Trace Flags Tab
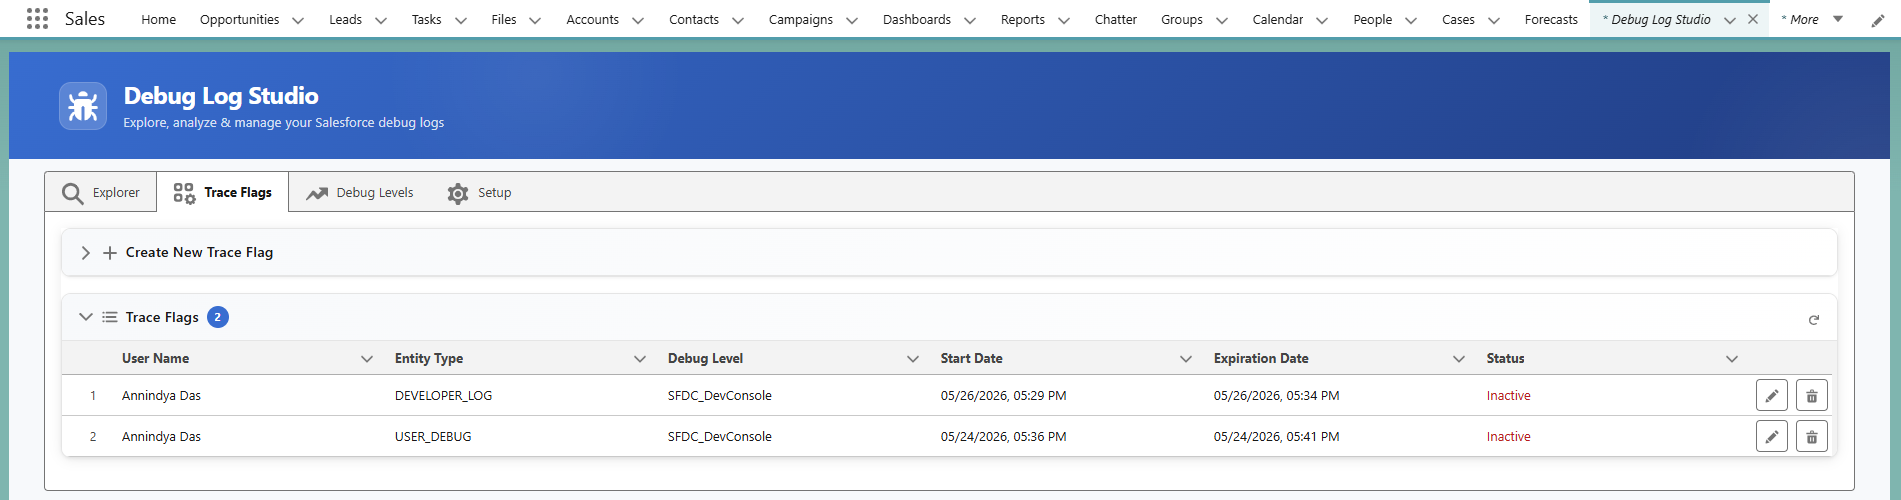
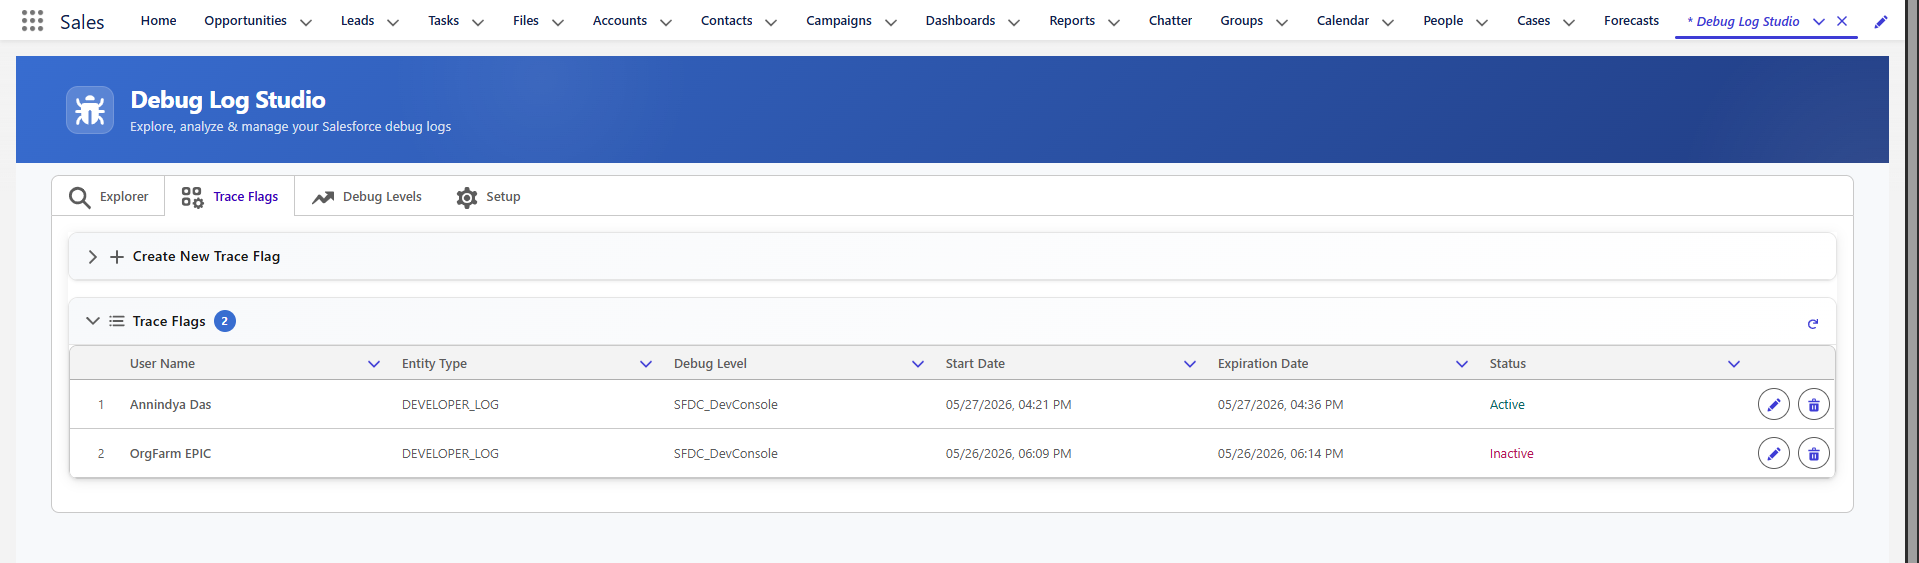
The Trace Flags tab lists all Trace Flags in your org with their status (Active/Inactive), Debug Level, and Start/Expiration times.
Extending a Trace Flag
- Click the Edit (pencil) icon on any row.
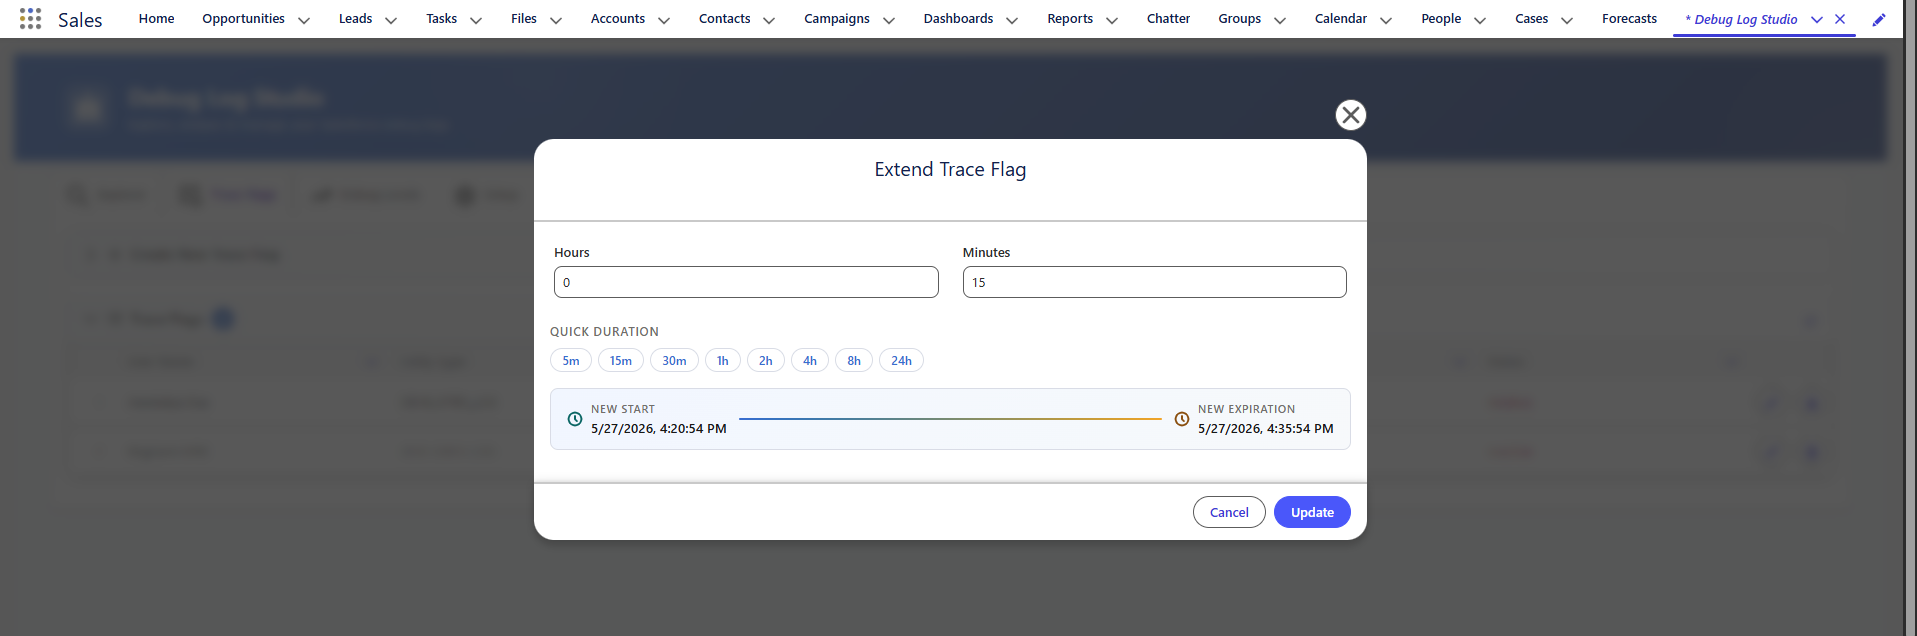
- In the Extend Trace Flag pop-up, set Hours and Minutes.
- Use Quick Duration presets (5m / 15m / 30m / 1h / 2h / 4h / 8h / 24h) for fast entry.
- The updated Start and Expiration times are previewed before saving.
- Click Update - the Status turns Active (green).
Creating a New Trace Flag
To capture logs for a specific user or entity:
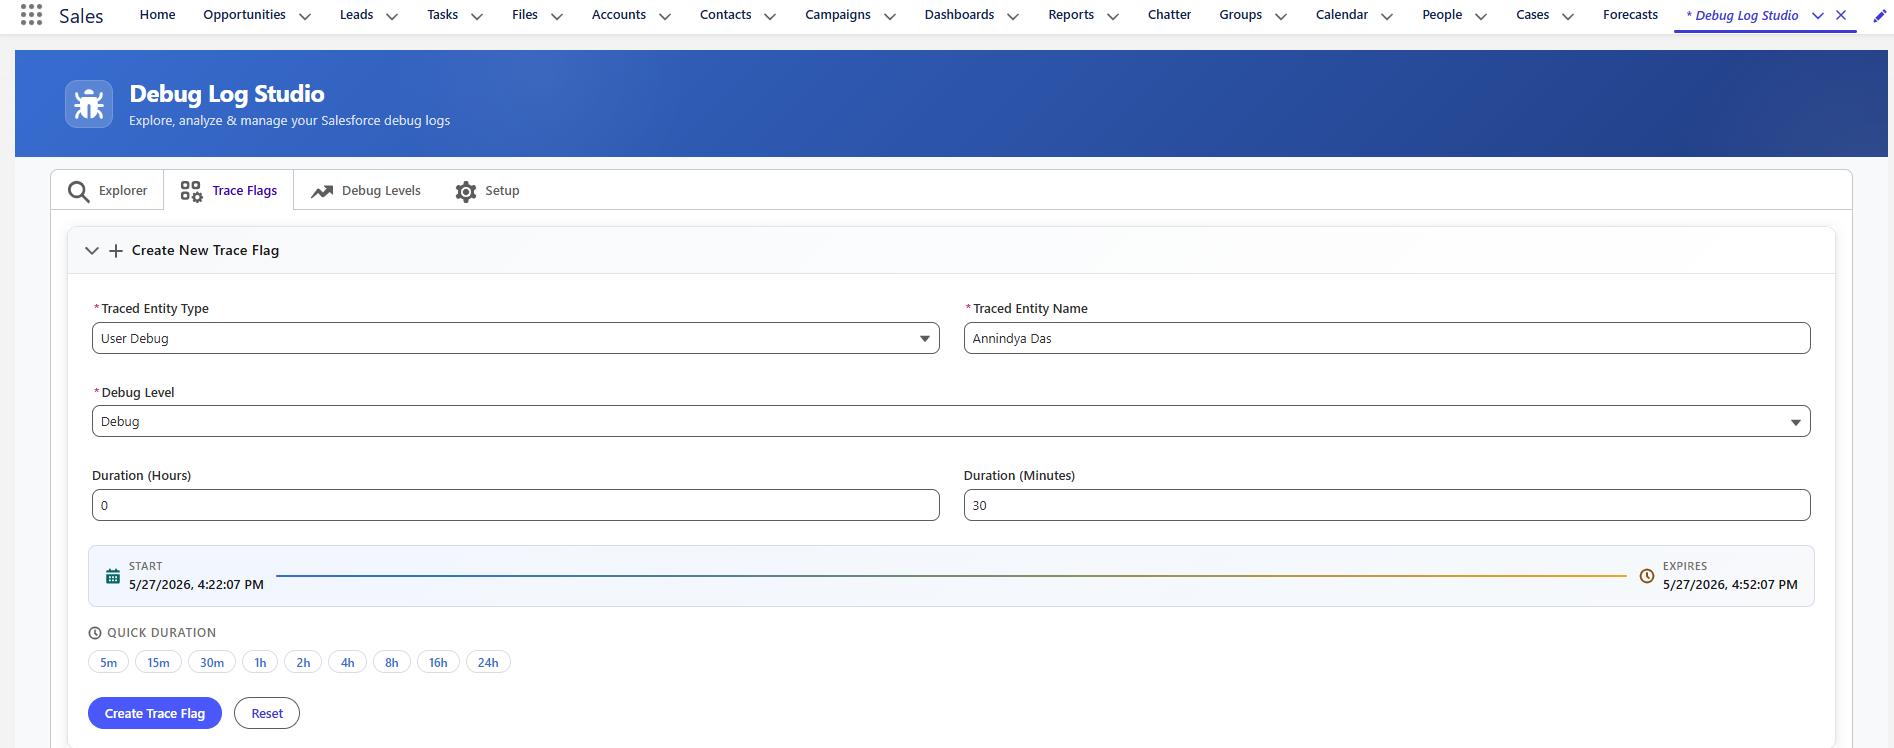
- Click ”+ Create New Trace Flag” to expand the form.
- Set Traced Entity Type, Traced Entity Name, Debug Level, and Duration.
- Use Quick Duration presets to set the expiration quickly.
- Click “Create Trace Flag”.
4. Explorer Tab
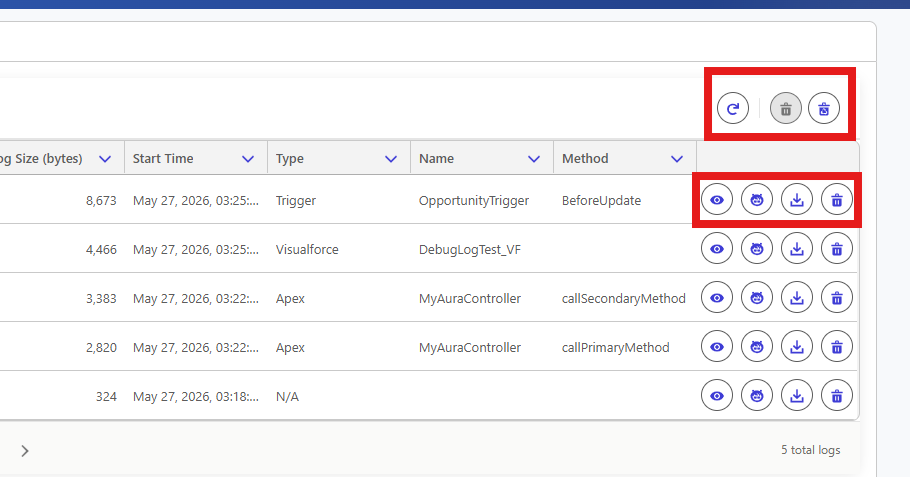
The Explorer tab is the main log viewer. With an active Trace Flag in place, trigger activity in your org then head here to see the captured logs.
Each row shows enriched metadata beyond the standard Salesforce log list: User, Request Type, Application, Operation, Status, Duration (ms), Log Size (bytes), Start Time, Type, Class Name, Method Type.
Available Actions
| Action | Description |
|---|---|
| View | Opens the full log in the Debug Log Viewer pop-up |
| Summarize | Launches AI analysis directly without opening the viewer |
| Download | Saves the log as a .txt file |
| Delete | Deletes the individual log |
| Mass Delete | Deletes all logs in the system in one click |
| Refresh | Fetches latest logs without refreshing the page |
5. Log Viewer & AI Summary
Log Viewer
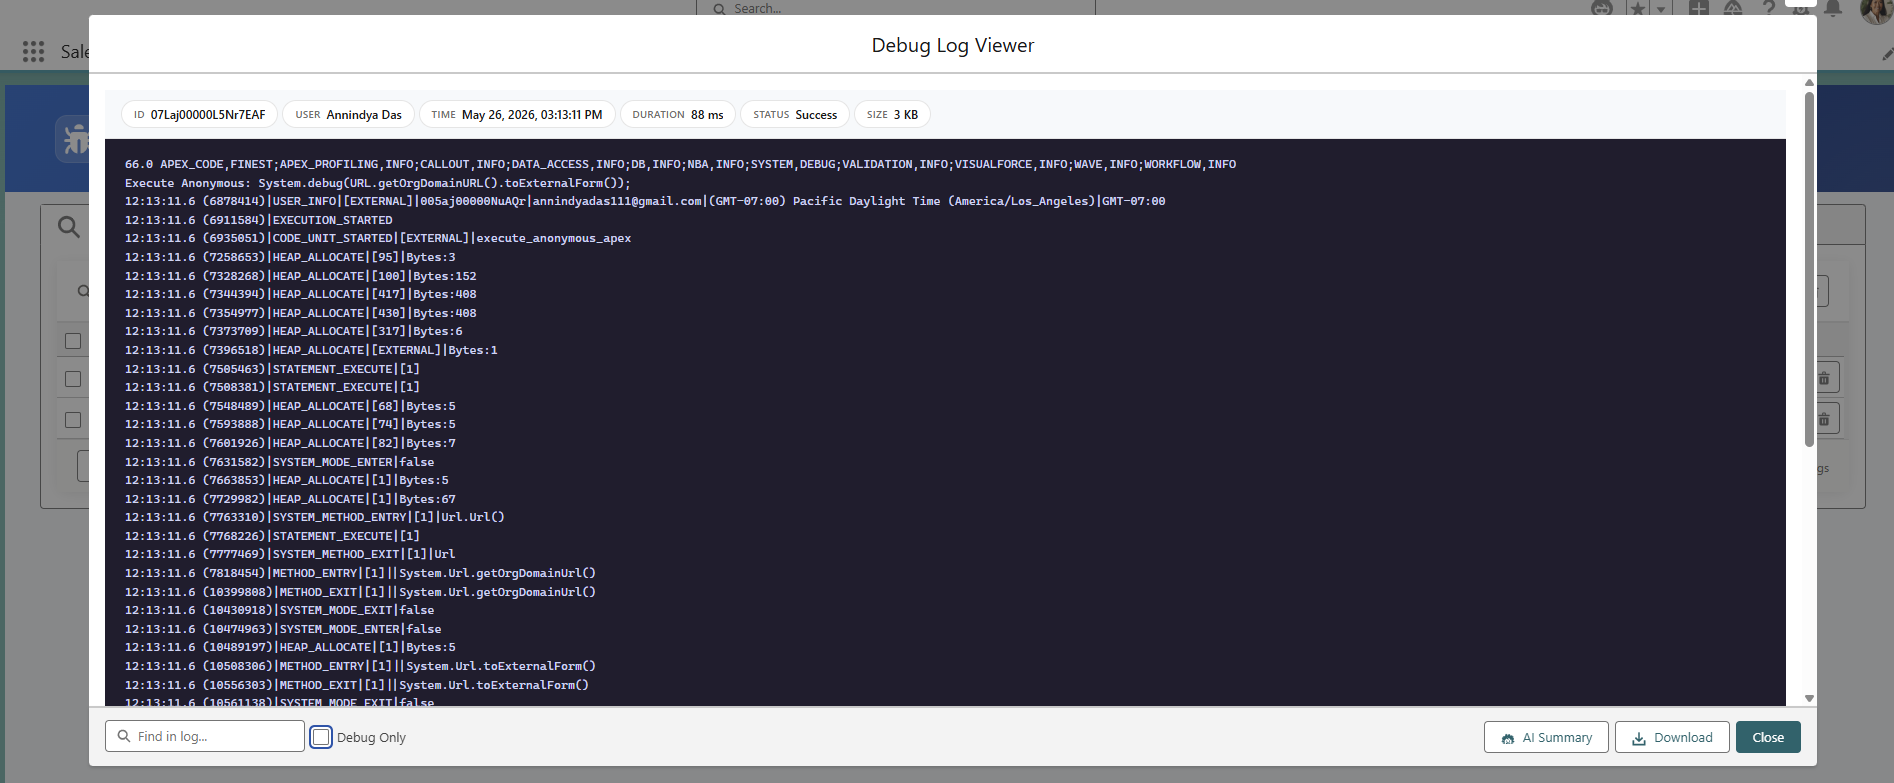
Click View on any log row to open the Debug Log Viewer - a dark-theme console showing the full raw log.
From the viewer you can:
- Find in log - search for any string within the log content
- Debug Only - toggle to show only
DEBUGstatements, filtering out all other noise - AI Summary - launch the AI analysis pop-up
- Download - save the raw log as a
.txtfile - Close - dismiss the viewer
AI Summary
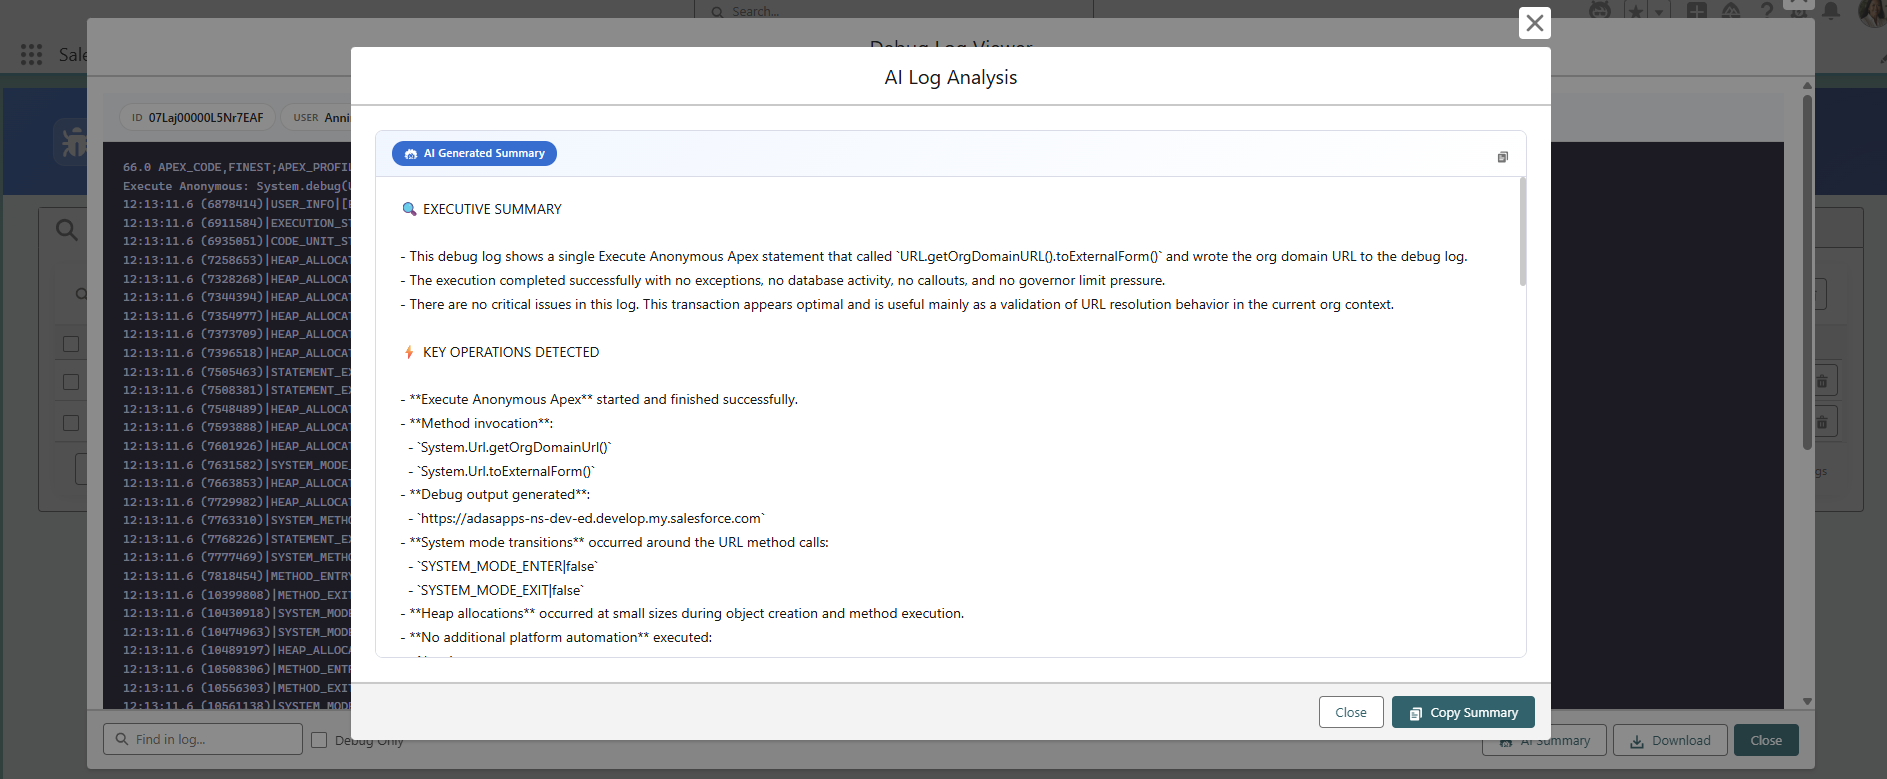
Click AI Summary (from the viewer or directly from the Explorer row) to open the AI Log Analysis pop-up, powered by Einstein AI.
The analysis includes:
- AI Generated Summary - concise overview of what the execution did
- Issues & Warnings - specific errors with line numbers and root cause explanation
- Suggested Code Fix - Apex code snippets showing exactly how to resolve each issue
- Optimization Recommendations - performance and best-practice suggestions
Click Copy Summary to copy the full analysis to your clipboard for sharing with your team.
6. Need Help?
- Raise an issue on GitHub
- Connect on LinkedIn
- Post-Install Setup Guide - if you haven’t completed setup yet
| *Debug Log Studio - Designed and Developed by Annindya Das | Built for the Salesforce community.* |